

One tower above everything you already run.
VisiQ is not another system to migrate onto. It is a layer that sits above your WMS, ERP, TMS and carrier feeds, reads what they already produce, and turns it into decisions your team can act on. Nothing gets replaced. Nothing gets ripped out.
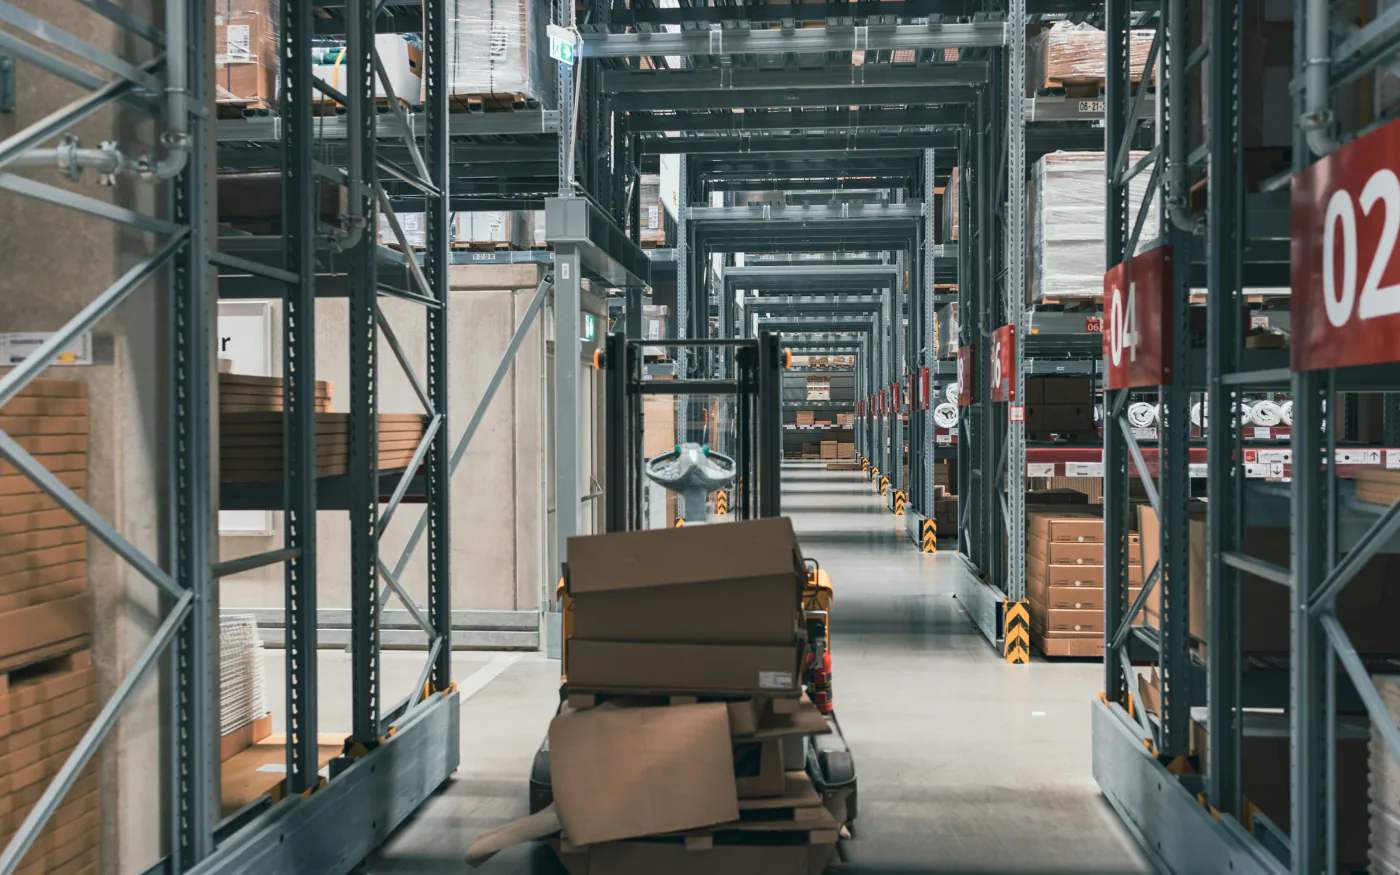
Every source. One vocabulary.
VisiQ connects to more than forty supply chain platforms through pre-built connectors, flexible APIs and event-driven pipelines. Most operations are unified in days, not quarters.
Pre-built connectors
The major WMS, ERP, TMS, OMS and labour platforms are supported out of the box, along with the carrier APIs behind them.
One common vocabulary
Orders, inventory, shipments and labour are mapped to shared definitions, so the same word means the same thing regardless of which system it came from.
Continuous, not nightly
Operational telemetry arrives continuously rather than in an overnight batch, because a decision window measured in hours cannot wait for a batch measured in days.
Anything bespoke
Whatever is custom connects through APIs, webhooks or file drops. If it has an endpoint, a database or an export, it can feed the tower.
Six layers, one connected stack.
Each layer does one job. Read the headline for what it means operationally; open the panel if you want the engineering detail.
Your systems
The WMS, ERP, TMS, OMS, labour and yard systems you already run — plus the carrier APIs behind them. VisiQ reads from them; it never writes back unless you ask it to.
Getting the data in
Events arrive in order, nothing gets lost, and anything that fails can be replayed. Reference data that changes slowly is refreshed on a schedule; operational events stream continuously.
Agreeing what words mean
A governed model fixes the meaning of every entity and relationship, so 'order', 'shipment' and 'customer' cannot drift apart between systems. This is the unglamorous layer that makes everything above it trustworthy.
Connecting it all up
The relationships get stored as relationships, not as rows waiting to be joined. That is what lets VisiQ trace a late order back to its root cause in one hop instead of five joins.
Reasoning over it
NaviQ answers by walking the actual chain of cause and effect, then explains it in plain English — and returns the path it took, so any conclusion can be checked rather than taken on trust.
Getting it to people
Dashboards, alerts, the chat surface and your own downstream systems all read from the same governed source, scoped to whoever is asking.
Why a graph rather than a warehouse?
A warehouse is excellent at aggregating and terrible at tracing. Asking 'why was this order late' in SQL means writing joins across five systems and guessing at the chain. In a graph the chain is the data structure — you follow the edges. Both have a place, which is why VisiQ keeps a warehouse for analytics and a graph for causality.
Why not just point an LLM at our database?
Because it will confidently invent the causal link. A model retrieving loose text chunks can summarise plausibly without any guarantee the relationship it describes exists. Walking a governed graph means every hop in the explanation is a relationship that was actually recorded — and the path comes back with the answer so you can audit it.
Do we have to replace anything?
No. That is the design constraint the whole platform is built around. Your systems of record stay authoritative and keep running exactly as they do today. VisiQ reads from them and adds a decision layer above.
Five questions the tower answers.
Each one starts as an operational question and resolves to a number on the P&L. The first four all feed the fifth.
Dock, yard and transport flow
“Which inbound loads will miss their appointment, and which trailers are building detention exposure right now?”
- Appointment
- Dock door
- Carrier
- Trailer
- Yard location
- Contract rule
- Detention and demurrage avoided
- Higher dock utilisation
- Lower carrier wait cost
Dynamic labour optimisation
“Which certified operators should move where in the next 60 to 120 minutes to protect SLA without paying overtime?”
- Task
- Skill
- Equipment
- Labour resource
- Order
- SLA deadline
- Lower overtime cost
- Better labour utilisation
- Higher pick, pack and ship productivity
Inventory velocity and execution risk
“Which SKUs look available in the ERP but are not actually pickable — and which orders are at risk despite showing sufficient stock?”
- Order
- SKU
- Inventory state
- Location
- Exception event
- Higher fill rate
- Fewer stockouts and expedites
- Better inventory turns
True cost-to-serve
Apex use case“Which customers look profitable at gross margin but turn loss-making once warehouse touches, detention, returns and accessorials are counted?”
- Customer
- Orders
- Task cost
- Freight
- Accessorials
- Returns
- Rework
- Accurate contract repricing
- Gainshare model design
- Accessorial recovery
- Client profitability
Exception intelligence
“Are late shipments driven by carrier failures, dock congestion, unpickable inventory, labour gaps, or order release timing?”
- Exception event
- Root cause
- Corrective action
- Business impact
- Systemic cost elimination
- SLA penalty prevention
- The foundation for autonomous action
What else you could do with the same budget.
| Capability | VisiQ | Traditional BI | Custom warehouse | New WMS reporting |
|---|---|---|---|---|
| Time to first value | 8–16 weeks | 3–6 months | 12–24 months | 12–36 months |
| Unifies multiple systems | Partial | |||
| Predictive, not just historical | Partial | |||
| Plain-language questions | ||||
| No system replacement | ||||
| First-year return | Typical | Rare | Uncommon | Uncommon |
Walk the architecture with our team.
Book 30 minutes and we'll go through the stack live, using the systems your operation actually runs as the worked example.