

The control tower that knows why.
Not another dashboard reporting what happened. A system that traces the cause, prices the consequence, and tells your team what to do while there's still time to do it.
- SLA compliance
- 98.4% +4.2%
- Orders today
- 1,247 +12%
- Cost per order
- $0.38 −8%
- SLA risk3 outbound orders will miss cut-off — Dock 4 congestion detected
- RecommendationMove 2 pickers from Zone B to Zone D → +8% throughput on the wave
- Root causeChicago freight +11.2% traced to carrier late-pickup surcharges
- 0%
- Labour productivity gain
- $0.00M
- Modelled annual value
- 0 wk
- Fastest deployment
- 0%
- Fewer SLA penalties
Connects natively with the systems you already run
No rip-and-replace. VisiQ reads from your stack; your stack keeps running exactly as it does today.
- SAP / SAP HANA
- Oracle WMS
- Manhattan Associates
- Blue Yonder
- Microsoft Dynamics 365
- Infios / HighJump
- NetSuite ERP
- Salesforce
- Snowflake
- 3PL Central
- Deposco
- FedEx · UPS · USPS
Dashboards tell you what happened. VisiQ tells you what to do next.
A modern DC runs five to ten disconnected systems. Each one holds a piece of the truth. None of them speak the same language. So your best people spend the morning reconciling instead of deciding — and by the time the picture is assembled, the window to act on it has closed.
Data fragmentation
WMS, ERP, TMS and OMS are each an island. Any question that crosses two of them becomes a manual reconciliation job, repeated every single day.
85% of ops managers name data silos as their top productivity killer
Reactive decision-making
Bottlenecks surface after they have already damaged the SLA. Exceptions get handled hours late, or not at all, because nobody saw them form.
73% of SLA breaches are preventable with predictive alerting
The reporting tax
Skilled operators spend 15–20 hours a week assembling reports that a machine should be assembling — capacity that never reaches the floor.
VisiQ removes roughly 60% of manual reporting effort
The world moved on. Has your stack?
Reporting tools gave you a better view of the same reactive cycle. Algorithm platforms let you configure more sophistication into it. A control tower breaks the cycle: it watches continuously, surfaces the decision before you go looking, and shows its working.
BI & reporting
You read. You decide.
- Dashboards you have to remember to open
- Reports you have to interpret
- Alerts you have to go investigate
- Decisions you reach too late to use
Algorithm platforms
You configure. You wait.
- Better algorithms, unchanged cycle
- Workflows you have to build first
- Models you have to keep tuning
- Still a human in the loop before anything moves
VisiQ control tower
It reasons. You stay ahead.
- Watches the whole operation continuously
- Surfaces the decision before you ask
- Explains the cause, not just the correlation
- Attaches the cost, so you can rank it
From signal to decision, in five moves.
Everything below runs continuously, not on a refresh schedule you have to remember.
Connect
Pre-built connectors for the WMS, ERP, TMS, OMS, labour and carrier systems you already run — plus files and APIs for whatever is bespoke.
Unify
Every source is mapped to one common vocabulary, so an order is an order whether it came from Manhattan, SAP or a carrier feed.
Relate
VisiQ links the pieces to each other — this order to that shipment to that dock door to that customer contract. This is what makes cause traceable.
Decide
Models watch the connected picture for risk forming — SLA exposure, labour shortfall, dock congestion — and rank what needs attention by what it will cost.
Act
The decision reaches the person who can act on it, with the reasoning attached. Routine exceptions can be handled automatically, under your governance rules.
Most systems store rows. VisiQ stores relationships.
That difference is the whole product. A table can tell you an order is late. Only a connected model can tell you it was late because inbound arrived short, which forced a partial pick, which triggered an expedite — and that the expedite cost $2,400.
SELECT * FROM order_hdr WHERE status = 'LATE'Finds the rows. Knows nothing about why.
Customer ABC's order was late because inbound inventory arrived short, causing a pick shortage, requiring expedited freight — costing $2,400 in accessorials.
A chain of cause you can follow, hop by hop.
Inbound
POs · ASNs · receipts · putaway · dock scheduling · supplier performance
Outbound
Customer orders · wave planning · pick · pack · ship · SLA commitments
Inventory
Positions · locations · lots · movements · availability · allocation
Labour
People · skills · activities · productivity · standards · cost
Transportation
Shipments · loads · routes · carriers · rates · accessorials · delivery
Financial
Revenue · cost centres · cost-to-serve · labour · freight · profitability
Customers
Customers · suppliers · 3PL clients · service agreements · SLAs · contracts
Exceptions
Events · exceptions · root causes · corrective actions · business impact

Three operating views. One connected picture.
The control tower is not an abstraction — it's the screen your team opens at 6am. Warehouse, transportation and network each get their own view, all reading from the same connected model.
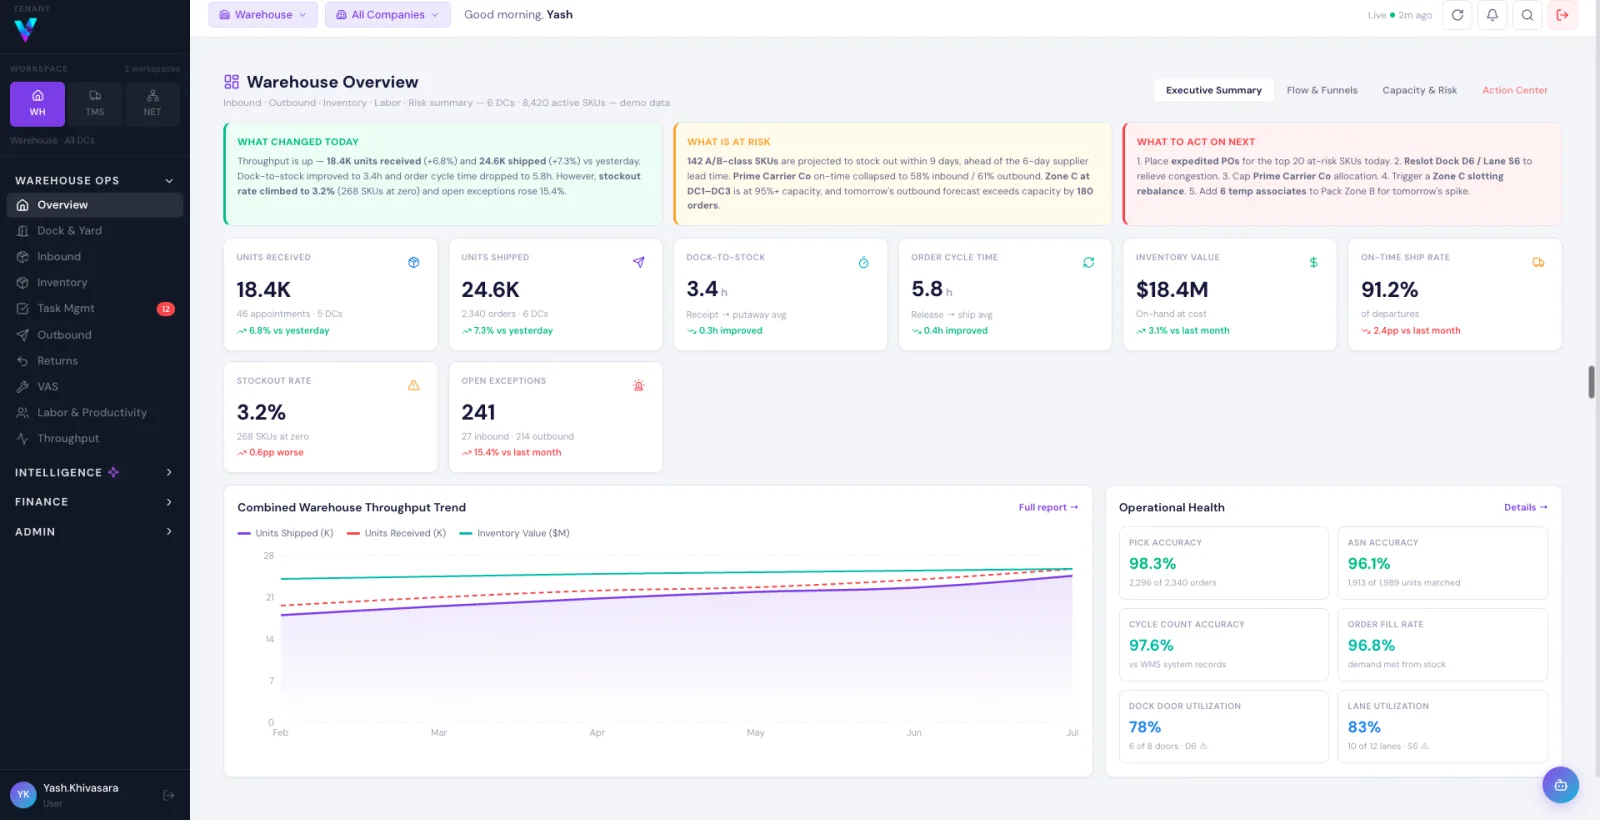
Dock to despatch, in one view
Dock activity, inbound flow, inventory, tasks, labour, throughput and outbound execution together — without replacing your WMS.
- See what moved since the last shift
- Exceptions and operational health side by side
- Risk turned into a ranked action queue
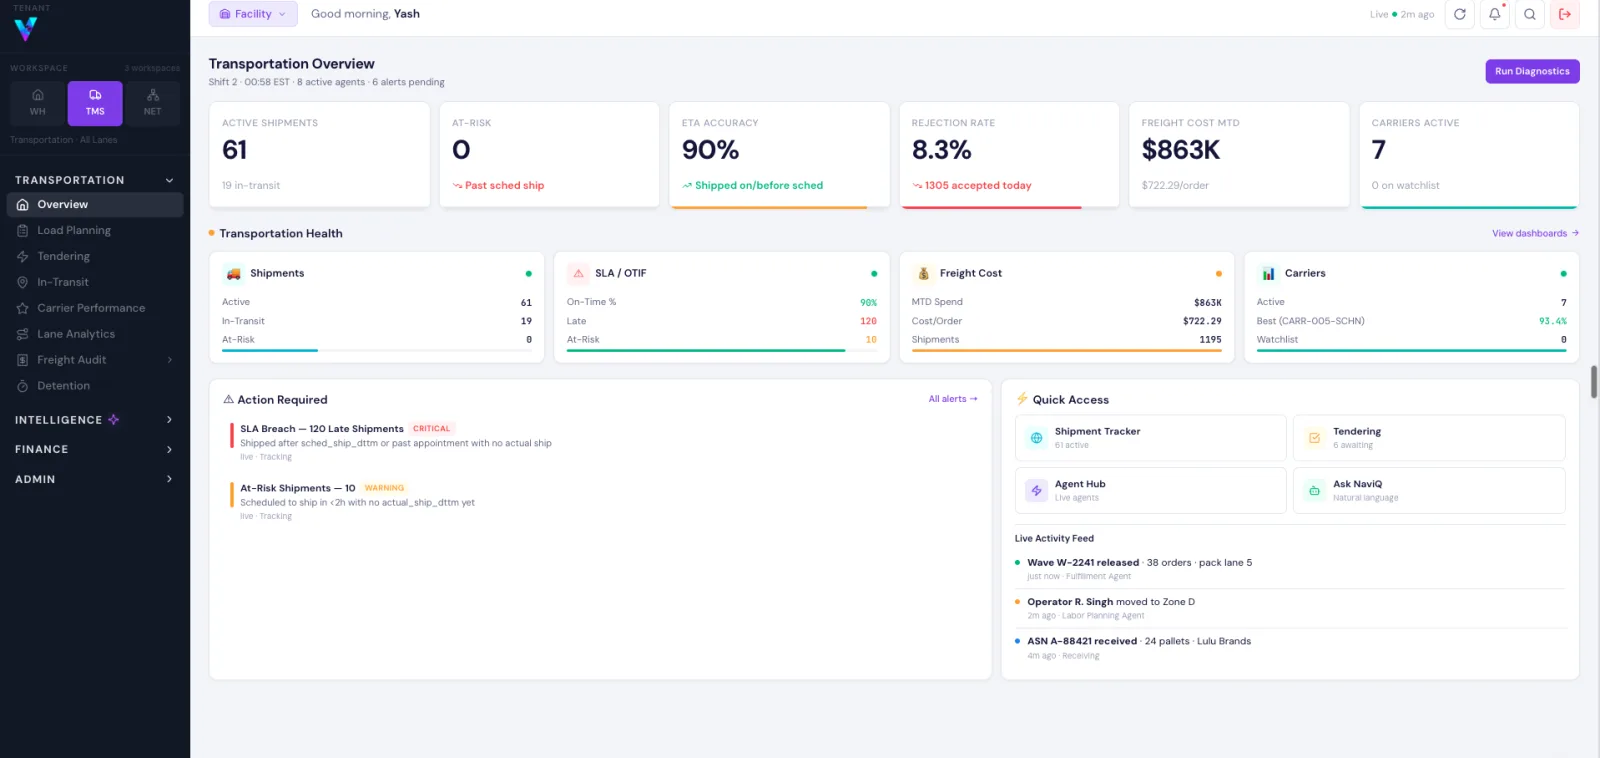
Every shipment, every carrier
Shipment status, tendering, carrier performance, lane analytics, freight visibility and detention exposure in one transportation view.
- Track active and at-risk shipments
- Compare carrier and lane performance
- Keep service and freight cost in the same frame

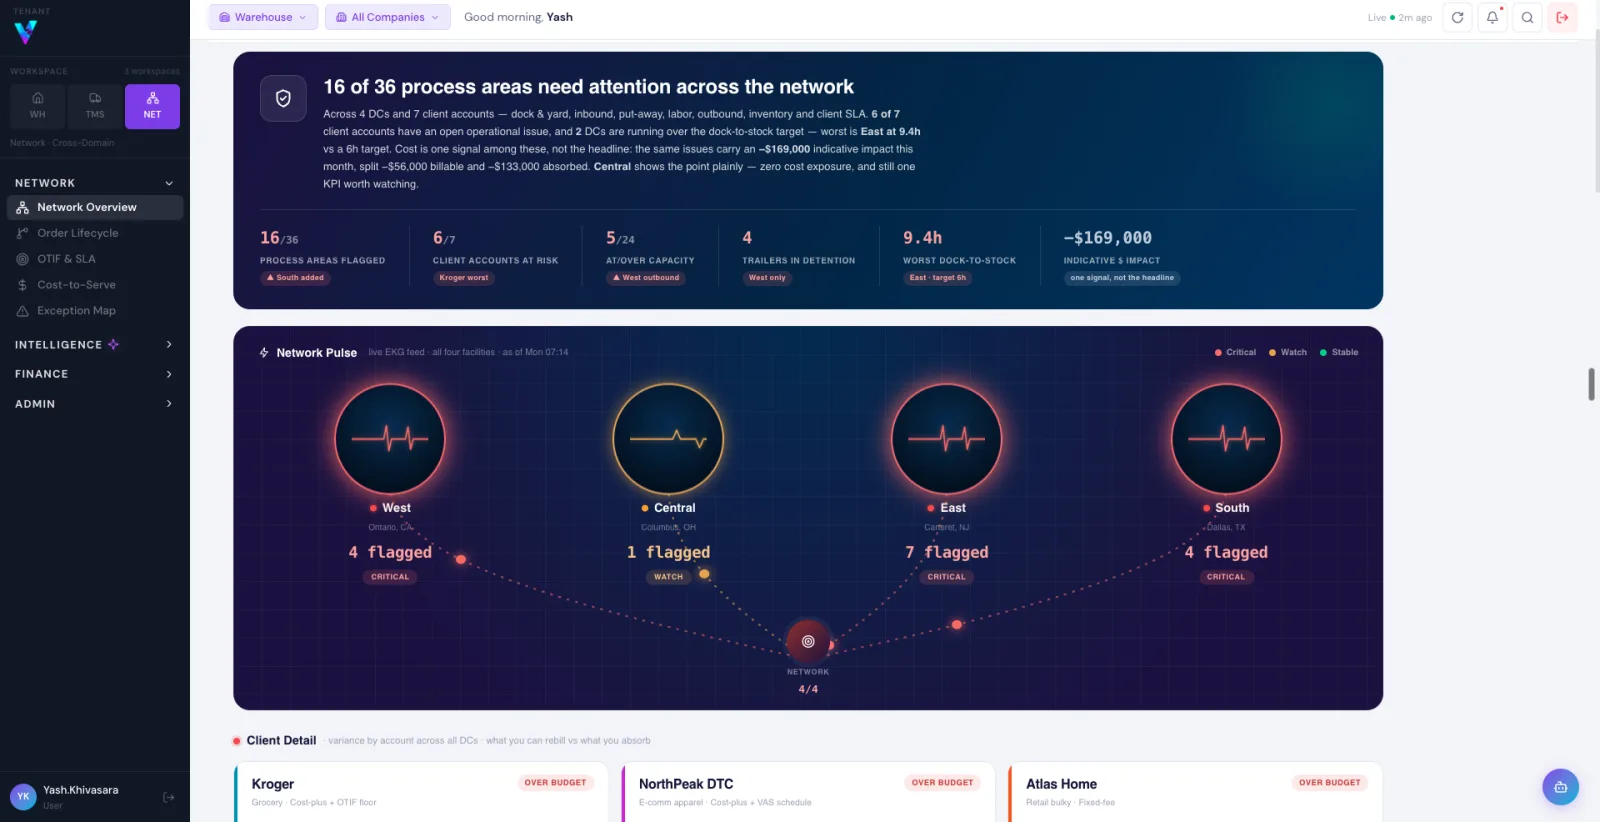
How a local issue becomes a customer problem
Facilities, orders, shipments, service commitments, exceptions and cost context connected — so you can see how one site's problem reaches the rest of the network.
- Compare operational health across facilities
- Trace an issue from process to client impact
- Prioritise attention at network level
Every decision has a dollar value.
The control tower doesn't stop at surfacing an operational decision. It traces that decision to its financial consequence — which is how cost-to-serve stops being a quarterly report and becomes a number you can act on today.
True cost-to-serve
Per customer · per order · per SKU
Detention, overtime, expedite cost and exception rework are all real costs that only become visible once the model connects them back to the customer P&L. That is the number that tells you which contracts are actually making money.
Built for the operations with the least room for error.

See what VisiQ would surface in your operation.
Book 30 minutes with someone who has run a DC. No generic slide deck — we'll walk through what the control tower would show for an operation shaped like yours.